For industrial systems that use MEMS accelerometers and gyroscopes, optimizing the bandwidth can be a critICal consideration. This presents a classic trade-off between accuracy (noise) and response time. While most MEMS sensor manufacturers specify typical bandwidth, it is often necessary to verify the actual bandwidth of the sensor or of the complete system. Characterizing the bandwidth of accelerometers and gyroscopes typically employs shaker tables or other mechanical excitation sources. Accurate characterization requires a thorough understanding of the motion being applied to the device under test (DUT). Several potential error sources must be managed in this process. One common source of error in mechanical bandwidth characterization is resonance. Mechanical resonance can result from poorly maintained excitation sources, poor DUT coupling to excitation source, reference sensor placement, and other sources. Isolating these types of errors can be time consuming and introduce risk into critical project schedules.
Most MEMS sensors have a self-test function, which provides the ability to test the sensor prior to deployment in a mission critical application. This function exercises the mechanical structure of the sensor to simulate the external forces it was designed to measure. This diagnostic can also be used to simulate a step input function. The response to this step input provides useful insights into the sensor's bandwidth. For example, the frequency response of the ADIS16080 yaw-rate gyro is dominated by its primary low pass filter, which is set at 40 Hz. The following response would be expected for a step input applied at the self-test pin:
r(t) = 1 - e-t2pf
This simple relationship between a sensor's step response and bandwidth can provide clues that will assist the verification process. The time constant of an exponential response is when the output reaches 63.2% of its final change in value. For a 40-Hz, single-pole system, this will happen at approximately 4 ms after the step response is applied.
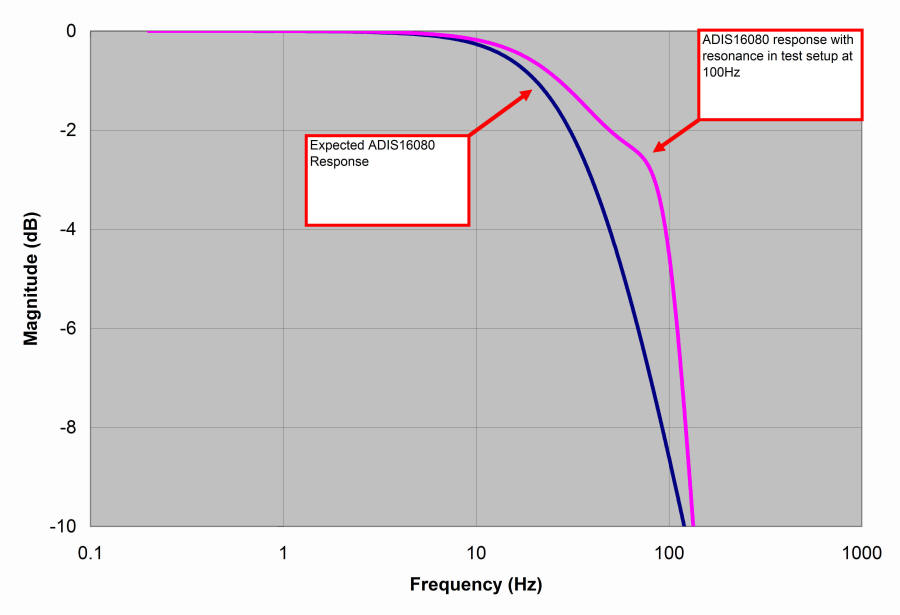
Determining the sensor's step response can be useful for isolating resonance conditions that are observed during bandwidth characterization. Figure 1 shows the frequency response of a system using an ADIS16080. The plot shows a resonance at 100 Hz. At first glance, we don't know whether this resonance is due to the sensor's behavior, or if it caused by a mechanical resonance in the system. Fortunately, the step response, as determined by the self-test function, can distinguish between these two effects. Figure 2 provides plots of both conditions: resonance resulting from test setup or from the sensor itself.


When using this technique, keep in mind that it relies on establishing a relationship between step response and frequency response. As filter structures get more complicated, establishing this link gets more difficult. For example, the time constant of a 2-pole, 56-Hz system is the same as the time constant associated with a single pole, 40-Hz system. Also, the rise time of the step input signal must be beyond the response time of the DUT. Slow response within the self-test function itself will affect the overall response and give the appearance of lower bandwidth in the sensor.
This technique provides an independent method for isolating unexpected behavior in the frequency response of MEMS sensors. It also provides the ability to quickly check a manufacturer's bandwidth claims, without requiring any mechanical excitation.


 客服微信
客服微信 查ic网订阅号

